46-View Web Dashboard
A modern React dashboard for managing your entire VM migration lifecycle.
Getting Started
To access the HyperSDK dashboard, open your browser and navigate to:
https://your-server:5080/web/dashboard/
On first launch you will see a login screen. Sign in with your system (PAM) credentials. If this is a fresh installation the default account is the Linux user that ran the installer. After login the browser stores a JWT session token in sessionStorage, so closing the browser tab ends the session automatically.
If your server uses a self-signed certificate the browser will show a TLS warning. You can either accept the warning for development use or install a trusted certificate (see the Deployment Guide for details).
Navigation
The sidebar on the left organizes every view into logical groups. Click a group header to expand or collapse its children. The sidebar is collapsible on smaller screens via the hamburger icon in the top-left corner.
| Group | Views | What You Can Do |
|---|---|---|
| Migration | 20 | Browse VMs, upload/download disks, batch migrate, compare source/target |
| Observability | 8 | Health score, alerts, processes, containers, security, debug tools |
| Infrastructure | 4 | Create VMs, manage snapshots, storage pools, ISOs |
| Core | 3 | Dashboard overview, export workflow, pipeline monitor |
| Tools | 11 | Cost estimator, backup scheduler, API playground, templates |
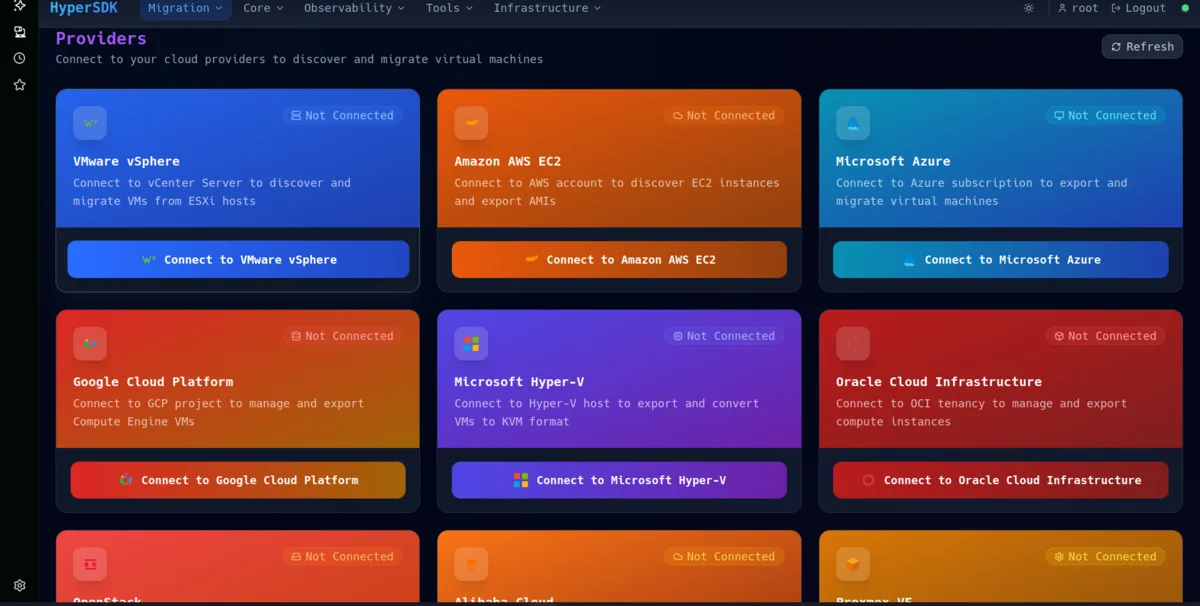
Migration Views (20)
The Migration group is the largest section and covers the entire lifecycle of moving VMs from source to target:
- Providers -- Connect to VMware vCenter, AWS, Azure, GCP, or bare-metal hosts.
- VM Browser -- View all discovered VMs with CPU, memory, disk, network, and OS metadata.
- Batch Select -- Select multiple VMs for bulk export or migration jobs.
- Export Wizard -- Step-by-step workflow that creates OVF/OVA export jobs.
- Import Wizard -- Upload disk images (VMDK, VHD, QCOW2, RAW) and register them.
- Upload Manager -- Drag-and-drop chunked upload with pause, resume, and retry support.
- Download Manager -- Pull disk images from the server or cloud storage to your local machine.
- Conversion Pipeline -- Monitor the 7-stage hyper2kvm pipeline (Fetch, Flatten, Inspect, Plan, Fix, Convert, Validate).
- Job Queue -- View all running, queued, completed, and failed jobs.
- Job Detail -- Drill into a single job for per-stage logs and timing.
- Source/Target Compare -- Side-by-side comparison of the original VM and the converted KVM guest.
- Disk Inspector -- Examine partition tables, filesystems, and boot sectors of imported disks.
- Manifest Viewer -- Review the JSON manifest generated by each export or conversion.
- Schedule Manager -- Create cron-based recurring migration windows.
- Migration Plan -- Group multiple VMs into a named migration plan with dependencies and ordering.
- Pre-Flight Check -- Run readiness checks before starting a migration batch.
- Post-Migration Report -- Auto-generated report comparing pre- and post-migration state.
- Rollback -- Revert a failed migration and restore the original VM state.
- Windows Tooling -- Auto-detect Windows VMs and inject VirtIO drivers (viostor, netkvm, balloon, qxl).
- Linux Tooling -- Review fstab rewrites, initramfs changes, GRUB patches, and VMware tools removal.
Observability Views (8)
Observability views give you real-time and historical insight into the health of your host and migrated VMs:
- Health Score -- A composite 0-100 score based on CPU, memory, disk I/O, and network saturation.
- Alerts -- Threshold-based alerts for CPU, memory, disk usage, and swap pressure. Configurable per-VM.
- Processes -- Live process table (similar to
top) showing CPU and memory per process inside each VM. - Containers -- Monitor Podman and Docker containers running on the host.
- Security Scan -- Audit open ports, running services, and known CVEs on converted VMs.
- Debug Console -- Interactive shell for running diagnostic commands against the HyperSDK daemon.
- Explain Mode -- Ask natural-language questions like "Why is CPU high?" and get contributing factors with recommendations.
- Metrics Explorer -- Query and graph any Prometheus metric exposed by
/api/v1/metrics.
Infrastructure Views (4)
Infrastructure views let you manage the KVM/libvirt layer directly:
- Create VM -- Build a new VM from scratch by specifying vCPUs, memory, disks, and network.
- Snapshots -- Create, restore, and delete libvirt snapshots for any VM.
- Storage Pools -- Manage libvirt storage pools (dir, LVM, NFS, iSCSI, Ceph).
- ISO Library -- Upload and manage ISO images used for VM installation or driver injection.
Core Views (3)
- Dashboard Overview -- Landing page with summary cards: total VMs, running jobs, health score, recent alerts.
- Export Workflow -- Visual representation of the export pipeline with stage-level progress.
- Pipeline Monitor -- Aggregated view of all active hyper2kvm pipelines with ETA and throughput.
Tools Views (11)
- Cost Estimator -- Compare cloud storage pricing (S3, Azure Blob, GCS) side by side based on your disk sizes.
- Backup Scheduler -- Schedule automated backups of VM disks to local or remote storage.
- API Playground -- Interactive REST client to test any HyperSDK endpoint directly from the browser.
- Template Manager -- Save and reuse VM configurations as deployment templates.
- Carbon Scheduler -- Schedule migrations during low-carbon-intensity grid windows.
- Bulk Operations -- Run start, stop, snapshot, or delete across many VMs at once.
- Network Mapper -- Visualize VM network topology and VLAN assignments.
- Log Viewer -- Tail HyperSDK daemon logs in real time with severity filtering.
- Config Editor -- Edit
hypersdk.yamlfrom the browser with syntax highlighting. - User Manager -- Create and manage user accounts, assign RBAC roles.
- Audit Trail -- Browse the audit log with filtering by user, action, resource, and date range.
Key Features
Real-Time Updates
The dashboard maintains a persistent WebSocket connection (wss://your-server:5080/ws) for live data. Job progress bars, health metrics, and alerts update automatically without page reloads. If the WebSocket drops, the dashboard reconnects with exponential back-off and shows a connection-status indicator in the footer.
Dark and Light Theme
Toggle between dark and light themes using the sun/moon icon in the top-right corner. Your preference is saved to localStorage and persists across sessions. The dark theme uses a neutral gray palette designed for extended use in data-center and NOC environments.
Responsive Layout
The dashboard is fully responsive. On tablets and phones the sidebar collapses into a slide-out drawer and tables switch to a card-based layout. The minimum supported viewport width is 320px.
Search and Filter
Every list view (VMs, jobs, alerts, schedules) includes a search bar that filters results as you type. Advanced filters let you narrow by status, date range, provider, OS type, and custom tags. Filters are composable and persist until you clear them.
Keyboard Shortcuts
Power users can navigate faster with keyboard shortcuts:
| Shortcut | Action |
|---|---|
/ | Focus the search bar |
g d | Go to Dashboard Overview |
g j | Go to Job Queue |
g v | Go to VM Browser |
? | Show all shortcuts |
Authentication
The dashboard uses the same PAM-based authentication as the REST API. After login a JWT is issued and stored in sessionStorage.
RBAC Roles
| Role | Permissions |
|---|---|
| Admin | Full access to all views, settings, user management, and system configuration |
| Operator | Create and manage jobs, VMs, providers, and schedules. Cannot modify users or system settings |
| Viewer | Read-only access to all views. Cannot create, modify, or delete any resource |
Role assignments are managed in the User Manager tool view or via the REST API at POST /api/v1/users/{id}/roles.
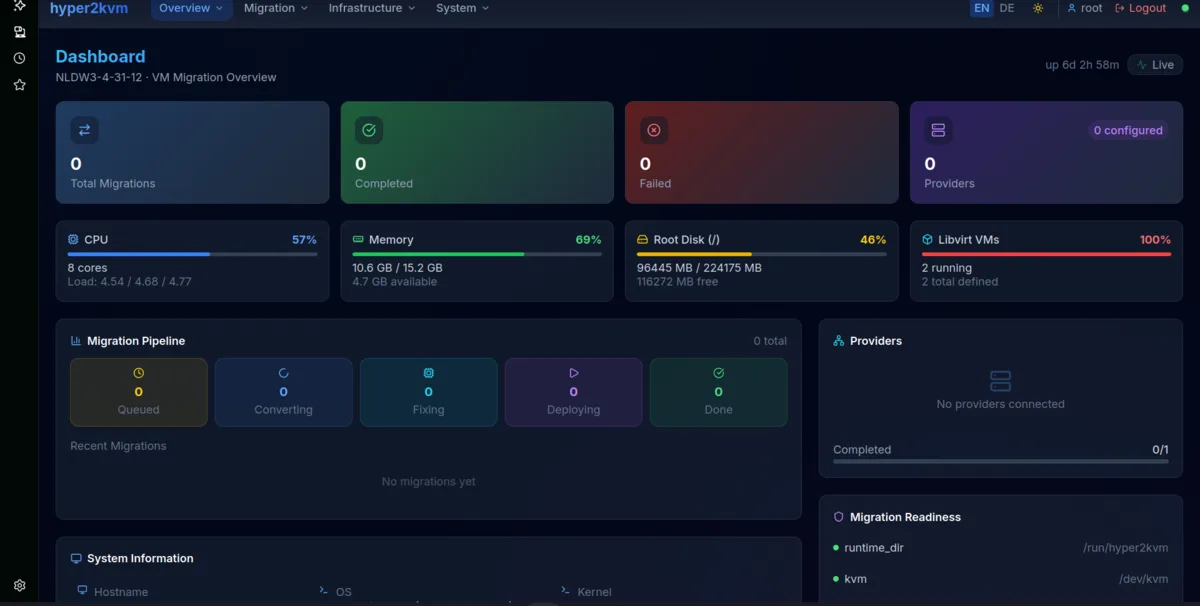
The hyper2kvm companion dashboard handles VM conversion and guest OS fixing.
Schedule a Demo to see the dashboard in action.